How The Food Pyramid Has Changed Over Time
Unless you are very new to this planet, you probably have a clear picture of the food pyramid seared into your mind's eye, or rather, a food pyramid. Chances are, the food pyramid you picture is the one officially adopted by the United States Department of Agriculture (USDA) in 1992.
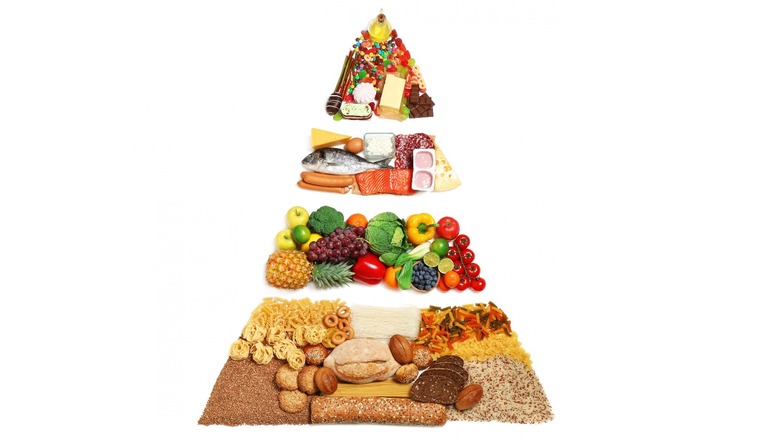
The 1992 food pyramid has six food groups divided into four levels. The base is composed of bread, cereal, rice, and pasta. The second layer contains the fruit and vegetable groups, leaning slightly heavier on the veg side. Level three includes your animal products: meat and dairy. Finally, the tip of the triangle is sugar, which we are warned to "use sparingly."
This may be what most of us picture when we think of the food pyramid, but it is no longer accurate. In fact, The New York Times reports that the pyramid was changed all the way back in 2005, and what's more, the pyramid that replaced that pyramid has now been replaced.
Perhaps our biggest takeaway from this should be the fact that our knowledge about nutrition is constantly evolving, and when you look at some of the outdated guidelines that preceded the famous pyramid, you can't help but wonder what we still don't know.
1943's Basic 7 food guide
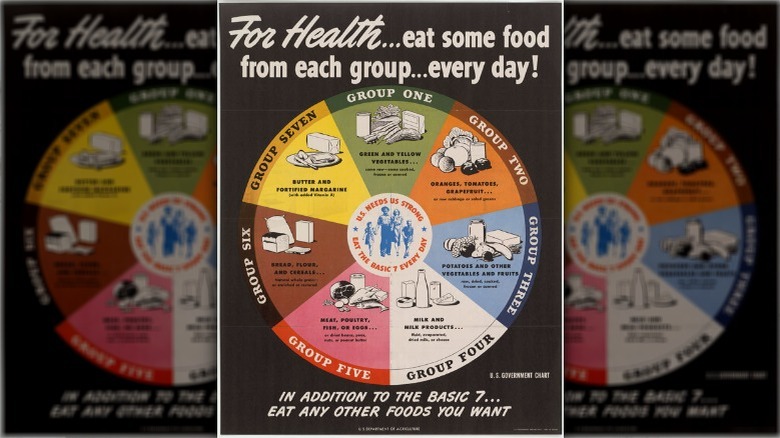
The Harvard School of Public Health published a history of USDA food guides, showing our government's many outdated attempts to inform public health. The earliest iteration was the "Basic 7" guide, introduced in 1943. In the midst of wartime, the guide urged Americans to eat a balanced diet because, in its own words, "U.S. Needs Us Strong."
The 1943 guide advised eating a portion from seven food groups, some of which were truly bizarre by modern standards. Sure, group five was a mundane "meat, poultry, fish, or eggs," but then you had the oddly specific group two, with "oranges, tomatoes, grapefruit ... or raw cabbage or salad greens," and group seven was just "butter and fortified margarine."
As you might be able to tell, it was a complicated system, and a dozen years later, the seven food groups were condensed into four: dairy, meat, grain products, and fruits and vegetables. If anything, this new system was a bit oversimplified, a fact the guide seemed to acknowledge with this disclaimer: "Plus other foods as needed to complete meals and to provide additional food energy and other food values."
The food pyramid of the 1990s
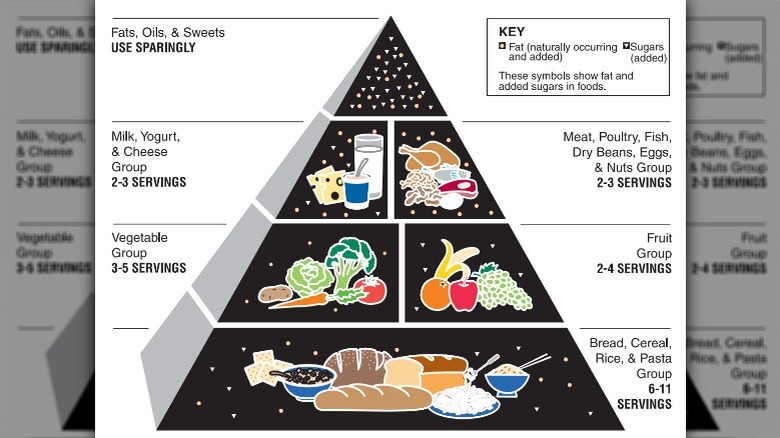
As previously mentioned, the version of the food pyramid most people are familiar with was introduced by the USDA in 1992. Per Scientific American, it was built on the general principles of minimizing fats and oils and maximizing complex carbohydrates. The infographic recommended eating six to 11 servings of grains every day, which constituted the foundation of the pyramid. One layer up, you have a recommended three to five servings of vegetables and two to four servings of fruit. The next layer included animal products, which recommended two to three servings of dairy and two to three servings of meat or eggs. At the top, it is advised to consume fats and sugars "sparingly."
However, scientists were immediately skeptical of the pyramid and criticisms against it quickly mounted. For one, the guide demonized all types of fat under one umbrella, whereas some kinds of fats are healthy and can even reduce the risk of heart disease, per Heart Foundation. On the other side of the spectrum, the pyramid promoted eating more carbohydrates than evidence suggests you should. These days, particularly in the fitness and nutrition scene, bread and pasta are often portrayed as the enemy of a healthy diet. It just goes to show how much our perception of nutrition has changed.
The 2000s food pyramid
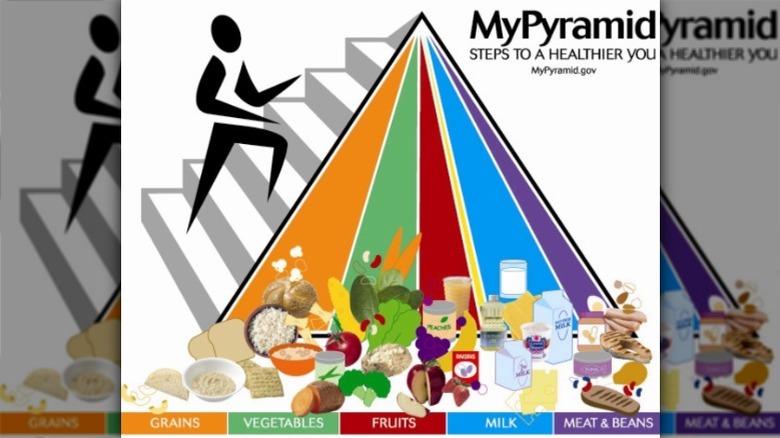
In 2005, the USDA debuted a new food pyramid titled MyPyramid that placed more emphasis on whole grains, distinguished between oils, and added a figure climbing the pyramid to promote exercise. But it too received criticism, with the Harvard School of Public Health calling the image "confusing."
As you can see, the pyramid is arranged as vertical slivers, with the size of the sliver denoting its importance. This was likely an attempt to get away from the idea of a hierarchy of foods where one food group is better than another, which was an interesting choice for a graphic designed to help people understand what foods are good for them. Another major difference was its creators didn't want to create a single pyramid for everyone since everyone's nutritional needs are different. So, instead of creating one pyramid, they created twelve. You were required to go to the now-defunct MyPyramid website and enter your age, gender, and level of physical activity before you could see the serving size suggestions based on which specific pyramid you matched with.
For all of its flaws, the usefulness of the 1992 graphic was centered on its simplicity. You can look at the graphic and get a rough idea of how to structure a balanced diet. The 2005 MyPyramid didn't share this trait. It sacrificed simplicity in order to speak more accurately to each individual and was ultimately discarded because it didn't strike the right balance.
Harvard's Healthy Eating Pyramid
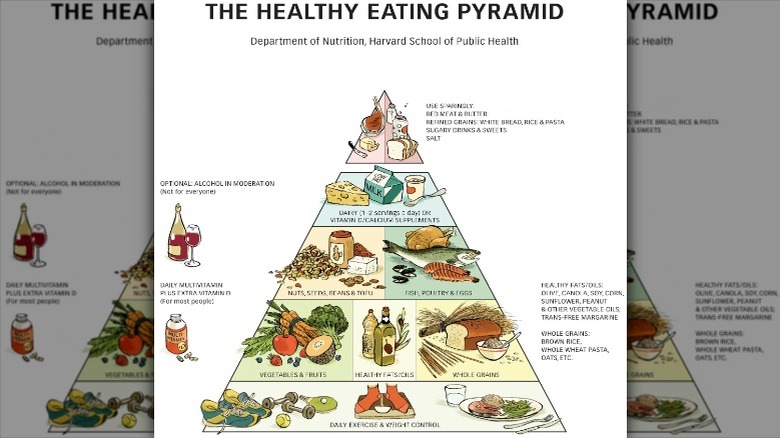
The exact origin of Harvard's Healthy Eating Pyramid is a little unclear, but it was initially created several decades ago, although the design we see today is an updated version created in 2008. It managed to find a good balance between nuance and simplicity while promoting exercise as part of a balanced diet. In fact, daily exercise and weight control are the foundation of the pyramid.
Interestingly, the pyramid doesn't give serving-size suggestions except for a recommended one to two servings of dairy towards the top. The lack of strict recommendations makes the pyramid loose enough to be applied to a wider range of dietary needs while having enough information incorporated into the graphic that a quick glance can inform the viewer of what their grocery list should essentially look like if they are trying to eat healthy. Although the design was never really adopted, Harvard would go on to contribute to the MyPlate project, which came out three years after the most recent update of this infographic.
Harvard Healthy Eating Pyramid: Copyright © 2008. For more information about The Healthy Eating Pyramid, please see The Nutrition Source, Department of Nutrition, Harvard T.H. Chan School of Public Health, www.thenutritionsource.org, and Eat, Drink, and Be Healthy, by Walter C. Willett, M.D., and Patrick J. Skerrett (2005), Free Press/Simon & Schuster Inc.
First Lady Michelle Obama's 2011 guide, MyPlate

In 2011, only six years after debuting their new, revamped food pyramid, the USDA decided to scrap the entire thing and replace it outright. The New York Times reports that the new guide, called MyPlate, was unveiled as part of then-First Lady Michelle Obama's efforts to combat nationwide obesity. It replaced the food pyramid with a barebones image of a plate and a cup, divided into five differently-portioned food groups: fruits, vegetables, protein, dairy, and grains.
MyPlate is the current graphic of choice for the USDA, but it hasn't been without criticism. Many have pointed out that the graphic is too simplistic to be truly helpful. For example, there's no mention of whole grains, and the protein portion could be filled with a greasy hamburger as easily as a piece of grilled chicken. There has also been confusion around the inclusion of dairy, with some commenters wondering what kind of influence agricultural subsidies have had on the graphic's development.
Although Harvard helped design MyPlate, they made a second version called the Healthy Eating Plate, which recommends water, tea, or coffee instead of milk and includes healthy fats as a food group. It also gives more insight into healthier versions of the food groups. For example, they recommend fish and poultry over bacon and processed meats. They also include a design element that encourages people to stay active since exercise is an important part of health.